



Enrollment Solutions
We are exploring ways to address enrollment fluctuations now and in the future.What's next?
The Administration is evaluating the findings of the 2026 Enrollment Study (see below), and will be having further conversation with the Board of Education at its Nov. 9 Committee of the Whole meeting.
Community Change & Student Enrollment Projections - October 2026
About MDRoffers Consulting
- Municipal, regional, and school district planning experts with 30+ years of experience
- Projected enrollment for ~50 Wisconsin school districts, including nearby Sheboygan Falls
- Use projection methodology that relies on analyzing new housing construction, demographic change, and household and neighborhood turnover
Presentation Outline
This presentation is a summary of MDRoffers Consulting’s more detailed Community Change & Projections reportRecent Trends
Overall Enrollment Decrease Over Past Decade- PSD enrollment decreased by 360 students, or 16% (greater than 8% decrease in public school enrollment statewide)
- Decreases occurred at all grade groups, but concentrated in the elementary (5K-4) grade group
- Open-enrollment-in of non-residents to PSD schools has remained stable over the past decade
- PSD residents open-enrolling-out to other public districts has increased over the past decade
- Overall, net negative open enrollment of ~60 students in 2025-26 academic year
- Enrollment at private schools operating in the PSD decreased by 97 students over past decade (-25%)
- This is a greater decrease than that which occurred in the PSD (-16%)
- This means that area private schools are similarly experiencing challenges in enrollment due to broad demographic and housing trends...
- Decreasing births since 2000, decreasing from 196 births to 145 births in 2025 (-37%)
- Greater than the 14% decrease in births across the State
- Suggests continued enrollment decreases due to smaller kindergarten and elementary school class sizes over the next few years
- Population aged 25-44 (i.e., reproductive-aged) decreased by 412 residents (-9%) in 2010s
- This age group contains much of the Millennial generation
- As of 2020, there are now 1,000+ more seniors aged 65 and older than there are school-aged children in the PSD, a reversal from the 2010 Census
- City of Plymouth experienced high levels of new housing development in the 1990s and 2000s
- New housing development decreased substantially in the 2010s, suggesting a slow bounce-back from the late-2000s Great Recession
- Lack of new housing development in 2010s directly related to recent trends of overall aging population, decreasing births, and decreasing enrollment
- Over the past decade, 417 new housing units built in City of Plymouth
- 40% of these permits were issued in 2025 alone, when 162 new housing units were permitted, mostly in new multiple-family units (apartments)
- This is the highest total in several years
- Consultant expects trend to continue, as several local and regional developers have become interested in Plymouth (including the Sheboygan County Economic Development Corporation), and the City has recently approved or received proposals for new single-family subdivisions and multiple-family developments
- PSD Student Generated per New Apartment (small sample size): 0.06
- PSD Student Generated per New Townhome (small sample size): 0.06
- PSD Student Generated per Existing Apartment: 0.14
- PSD Student Generated per Existing Single-Family Home: 0.28
- PSD Student Generated per New Single-Family Home: 0.53
- Consultant compared home sale addresses to PSD student addresses
- Analysis discovered that each single-family home sale over past 5 years generated an average of 0.35 PSD student
- This means one student is generated for every three existing homes sold
- Similar to most school districts, which often generate around 0.30 student generated per recent home sale
- High number of home sales in the early-2020s driven by low interest rates and pandemic-driven shifts
- Interest rate increases occurred in 2022, 2023, and 2024... decreasing home sales by over 30%
- 2024 and 2025 = stable home sales as home buyers become used to higher rates, still lower than historical average
- High(er) interest rates expected to continue for a few years, resulting in fewer home sales (and related enrollment impact)
Projection Methodology Overview
- Divided PSD into 61 neighborhoods, using elementary attendance areas, major roads,rivers, other geographic factors
- Estimated housing units by neighborhood as of June 2026
- Calculated current student-per-housing unit ratios for each grade group and each neighborhood using June 2026 student addresses
- Analyzed demographics, existing housing, & future housing expectations for each neighborhood using municipal plans, recent and pending developments, and discussions with planners and real estate experts
- Projected housing growth for 2027, 2030, 2035, and 2040 in each neighborhood
- Projected PSD student-per-housing unit ratios for each neighborhood, year, and grade group
- Multiplied projected housing units by student-per-housing unit ratios in each neighborhood to arrive at PSD resident student enrollment projections for each neighborhood
- Included projected open-enrollment-in students, held constant from the number in the 2025-26 academic year, resulting in a total students-in-seats projection
Housing Projections
Overview of Housing Projections- We project 1,303 new housing units in the PSD by 2040 (~91 per year)
- Driven by:
- SCEDC report showing a significant unmet need/pent-up demand for new housing
- SCEDC proven success in building housing across County
- Municipal plans supportive of new housing development
- Municipal infrastructure to support growth
- Strong interest from regional developers & home builders
- Significant development breaking ground in 2027
- Access to local and regional employment centers
- Most housing projected in City of Plymouth (86% of all new housing), lower amounts in Towns and Village of Cascade
- About 48% of new housing projected to be new single-family homes (with higher student generation rate)
- 52% expected to be new multiple-family housing (with lower student generation rate)
- New housing development concentrated on south side of City (Highway 67 corridor) and east side of City (Highway 57 corridor)
Total Housing Projected by Elementary Attendance Area
41% of all new housing through 2040 projected in the current Fairview attendance area, 39% in current Parkview attendance area, and 20% in current Horizon attendance area
- Remember that newer single-family homes generate students at the highest rates
- 62% of projected new single-family homes (+384) in current Parkview area
- Lower numbers of new single-family homes projected in current Horizon and Fairview attendance areas
Enrollment Projections
Total Enrollment (EC-12)Between June 2026 and 2040, we project a decrease of 248 EC-12 students—or 17 fewer EC-12 students per year on average
Assumptions:
- Private schooling, home schooling, & open-enrollment-out held constant from 2025-26
- Constant number of open-enrollment-in students attending each school as during the 2025-26 academic year
- We project total enrollment in grades EC-4 at PSD elementary schools to decrease by 62 students through 2040, with most of that decrease projected over the next few years, with enrollment thereafter stabilizing
- Decreasing enrollment projected at Horizon (-46 students) and Fairview (-13 students)
- Stable enrollment projected at Parkview (-3 students) due to new housing development, especially new single-family homes, in the current Parkview attendance area
- We project a decrease of 70 grade 5-8 students at Riverview Middle by 2040
- Enrollment expected to decrease through mid-2030s and stabilize by 2040
- We project a decrease of 135 grade 9-12 students at Plymouth High by 2040
- Enrollment expected to decrease through 2040
- Grade 9-12 decrease is due to larger current high school class sizes, which average 177 students per grade compared to current elementary class sizes, which average 117 students per grade
- Alternative scenario: What would future enrollment be if there was no new housing built through 2040?
- Main factors affecting enrollment = births, demographic trends, aging housing stock, and turnover of housing through home sales
- Under this alternative scenario, projected enrollment would instead decrease by over 540 students by 2040 (rather than the actual projected 248 student decrease)
- Takeaway: maintaining even stable enrollment requires a substantial amount of new housing
Comparing Enrollment Projections to Current Building Capacities
A Word about Potential Building Capacity...- Enrollment projections gain significance when compared to school building capacities
- Building capacities provided by PSD administration by multiplying the number of core classrooms in each school building by the median class size per grade served, based on district class size policies
- Projected 2040 grade EC-4 enrollment is around 490 students fewer than combined building capacity of all three PSD elementary schools
- Projected 2040 grade 5-8 enrollment around 330 students fewer than Riverview Middle School building capacity
- Projected 2040 grade 9-12 enrollment around 650 students fewer than Plymouth High School building capacity
Archive
Current structure for 2026-27
Thank you to all who attended our "Enrollment Solutions" community meetings and/or responded to our feedback surveys.
We recently shared the feedback with the Board of Education (view slideshow). The board requested that we commission a detailed enrollment forecast to project 5, 10, even 15 years into the future. This information will help us evaluate all of the proposed solutions for managing our district's enrollment.
The study will take place during the summer months, with results presented to the board in the fall of 2026. Because of this timeline, the district will keep the current elementary structure for the 2026-27 school year, though we remain committed to matching our staffing to enrollment needs.
Declining enrollment
Like most school districts in Wisconsin and around the nation, we are seeing declining enrollment.
Looking back
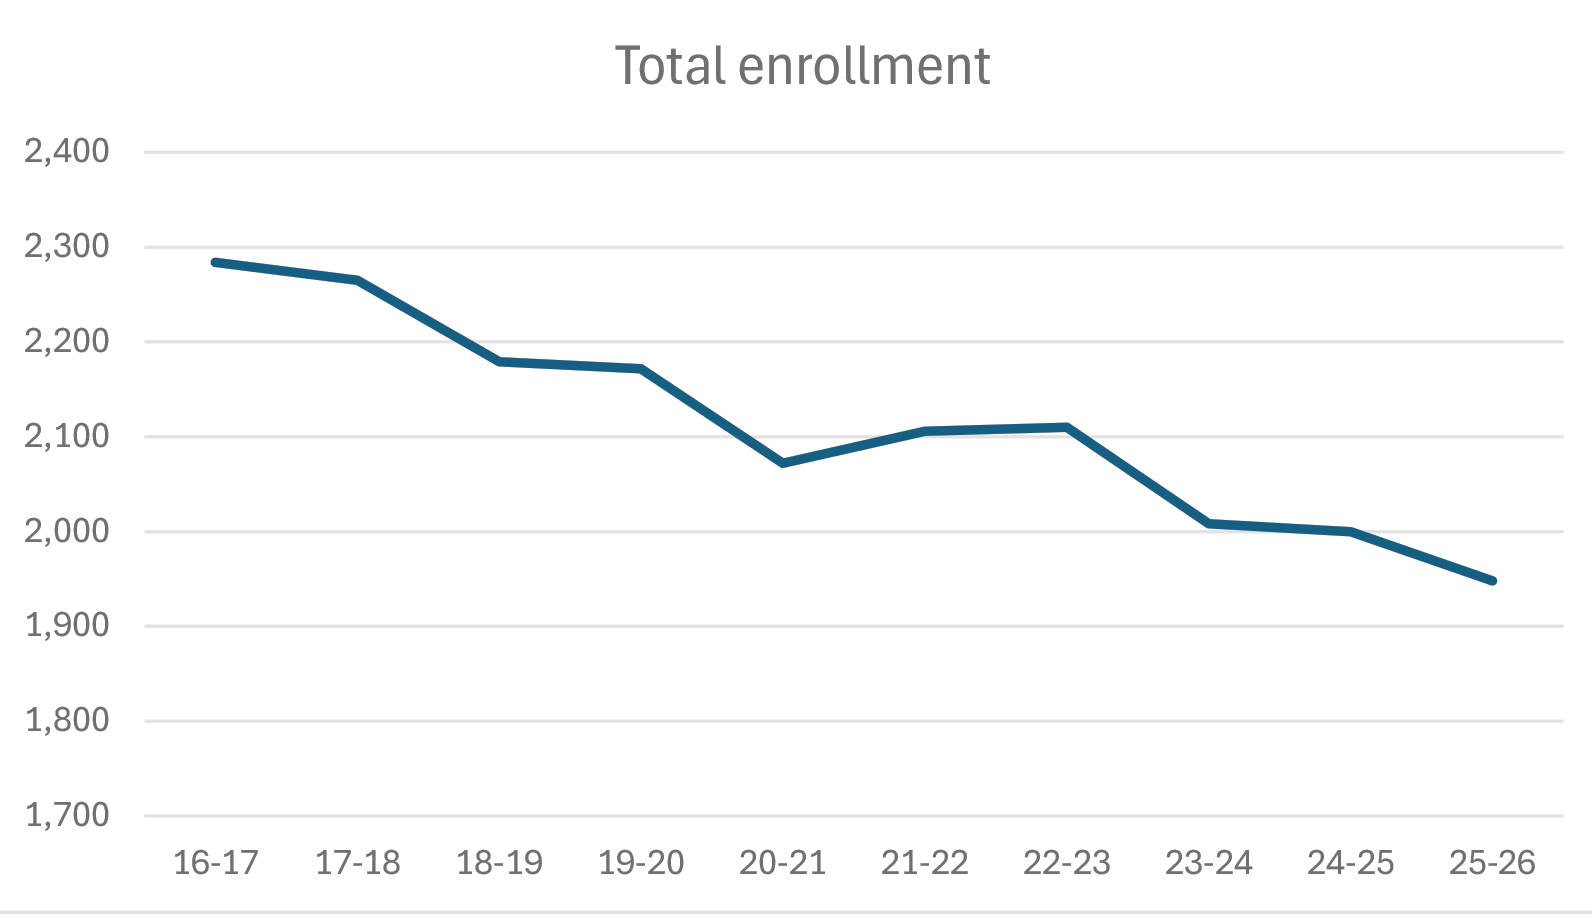
We are down 52 students this year and down 336 students in the past 10 years.2016-17: 2,284
2017-18: 2,265
2018-19: 2,179
2019-20: 2,172
2020-21: 2,072
2021-22: 2,106
2022-23: 2,110
2023-24: 2,008
2024-25: 2,000
2025-26: 1,948
Most of our biggest classes have graduated:
187 graduated in 2025
189 graduated in 2024
173 graduated in 2023
181 graduated in 2022
204 graduated in 2021
Looking ahead
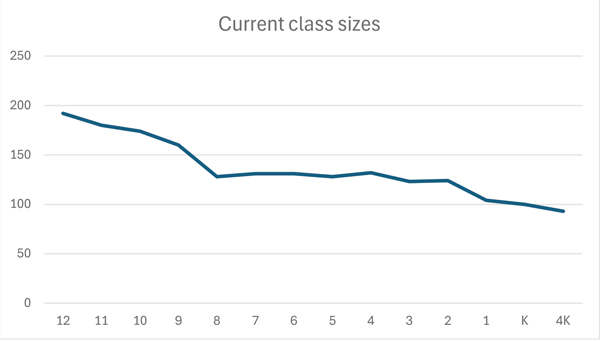
Incoming classes have been getting significantly smaller.Official 3rd Friday counts:
Current Grade 12: 192
Current Grade 11: 180
Current Grade 10: 174
Current Grade 9: 160
Current Grade 8: 128
Current Grade 7: 131
Current Grade 6: 131
Current Grade 5: 128
Current Grade 4: 132
Current Grade 3: 123
Current Grade 2: 124
Current Grade 1: 104
Current Grade K: 100
Current Grade 4K: 93
PHS picks up about 26 students on average from private schools:
Class of 2029: 148 in 8th grade to 160 in 9th = 12
Class of 2028: 140 in 8th grade to 179 in 9th = 39
Class of 2027: 160 in 8th grade to 182 in 9th = 22
Class of 2026: 155 in 8th grade to 186 in 9th = 31
Class of 2025: 160 in 8th grade to 187 in 9th = 27
Impact
While as educators we love smaller class sizes, our staffing and number of classes should reflect our enrollment to be fiscally responsible.
We want a solution that is proactive, so we can:
- Use attrition to reduce staff when possible.
- Avoid re-assigning students in August.
- Maintain similar class sizes in a given grade.
One option: Elementary restructuring
One possible solution is to restructure our elementary schools. What this might look like and some of its advantages and challenges are outlined below.
Slideshow 2: Enrollment Trends, Implications, and Solutions, Continued - October-November 2025
Agenda
- Share survey feedback
- Answer some FAQs (still working on others!)
- Explore multiple alternatives
- Outline next steps
Feedback survey responses
Are you a district employee?: 144 responses, 66% yes, 34% noIf yes, at which school do you primarily work?: 36.2% PHS, 22.3% Horizon, 14.9% Riverview, 13.8% Fairview, 12.8% Parkview
Do your children currently attend one or more of our schools?: 54.2% yes, 45.8% no
What are you excited about?
Staff:
Collaboration
Grade cohort
More even class sizes
Parents/community:
Full-day 4K
Staff collaboration
What concerns do you have?
Staff:
Additional transition for students
Breaking up staff teams
Inconsistency of not including Parkview
Parents/community:
Additional transition for students
Separating siblings
Parent drop-off/pick-up
What additional info would you like?
Staff:
Map of schools with classes laid out
How will this impact childcare?
Why do families leave the district?
Parents/community:
Why not include Parkview?
Why not wait for the new housing?
What are class sizes in all grades?
What other solutions should we pursue?
Re-evaluate elementary school boundaries
Put new families where there is room
Build one big elementary school
Close one school & have 2 elementary schools
Include Parkview & group by 4K-5K, 1-2, 3-4
Move 5th-grade back to elementaries
Frequently Asked Questions
What are class sizes in all grades?4K: 94 students in 6 classrooms, averaging about 16/class - 14-15-15-15-17-18
5K: 100 students in 5 classrooms, averaging 20/class - 19-19-20-21-21
1st: 103 students in 5 classrooms, averaging 21/class - 18-19-21-22-23
2nd: 126 students in 6 classrooms, averaging 21/class - 18-18-21-21-24-24
3rd: 124 students in 6 classrooms, averaging about 21/class - 19-20-20-21-22-22
4th: 132 students in 6 classrooms, averaging 22/class - 21-22-22-22-22-23
Why do families choose other schools?
Principals have called families whose children attend other schools via Open Enrollment.
Most of these students never attended our schools.
-Some began in another district and wanted to continue there after moving to our area.
-Other parents chose what was convenient for them, based on proximity to child care and/or work.
Why not include Parkview?
Initially there were transportation concerns, but Johnson Bus is committed to finding workable solutions.
Thanks to feedback, we’ve since looked at several alternatives involving Parkview.
Why not just wait for new families?
Immediate impact: The new housing developments have not started.
Future impact: When they do, construction is expected to take years.
While we want to be in a position to react to future increases in enrollment, we have to address declining enrollment now.
Declining Enrollment
Enrollment looking back
2016-17: 2,2842017-18: 2,265
2018-19: 2,179
2019-20: 2,172
2020-21: 2,072
2021-22: 2,106
2022-23: 2,110
2023-24: 2,008
2024-25: 2,000
2024-25: 1,948
Down 52 students this year; down 336 students in 10 years
Enrollment looking ahead
Our biggest classes have graduated: 187 in 2025, 189 in 2024, 173 in 2023Incoming 4K classes are much smaller: 94 for 2025-26, 100 for 2024-25, 93 for 2023-24
Impact
To be fiscally responsible, the numbers of classes and staff need to reflect our enrollment.We want a solution that is proactive, so we can:
- Use attrition to reduce staff when possible.
- Avoid re-assigning students in August.
- Maintain similar class sizes in a given grade.
Options
Option A: Current structureHow it might look:
-Continue with 4K-4th grade at all schools
-Continue going from 2 classes to 1 in a grade level as warranted (at 1 or more schools) and reduce that staff accordingly
-Continue to re-assign students to other schools in August to balance class sizes
Option B: Initial proposal
How it might look:
-School 1: Grades 4K, 5K, 1 with 3K and all childcare options
-School 2: Grades 2, 3, 4 with Extra Mile childcare
-School 3: Grades 4K through 4 with Berry Branch & Extra Mile childcare
Option C: Include all 3 schools
How it might look:
-School 1: Grades 4K & 5K with 3K, Mulberry Bush, & Berry Branch childcare
-School 2: Grades 1 & 2 with Extra Mile childcare
-School 3: Grades 3 & 4 with Extra Mile childcare
Option D: Early Learning Center
How it might look:
-School 1: 4K with 3K and all childcare programs
-School 2: Grades 5K, 1, 2
-School 3: Grades 3 & 4
What’s Next?
Scheduled meetingsFollow-up Elementary Staff Meetings:
-Horizon 8am Oct. 27
-Fairview 8am Oct. 30
-Parkview 8am Oct. 31
Community Meeting #2: 5:30pm Nov. 5
Committee of the Whole: 5:30pm Nov. 10
Possible timeline
Regular Board Meeting - Initial Recommendation? 5:30pm Nov. 18
Committee of the Whole - Further Discussion? 5:30pm Dec. 8
Regular Board Meeting - Board Action? 5:30pm Dec. 16
Slideshow 1: Enrollment Trends, Implications, and Solutions - September 2025
Agenda
- Outlining the challenge
- Enrollment trends
- Remedies already implemented
- Implications of declining enrollment
- Proposed solution
- Advantages and hurdles
- Next steps
The Challenge: Declining Enrollment
2016-17: 2,2842017-18: 2,265
2018-19: 2,179
2019-20: 2,172
2020-21: 2,072
2021-22: 2,106
2022-23: 2,110
2023-24: 2,008
2024-25: 2,000
Not Just Us
- Birth rate is down in Wisconsin
- Public school enrollment is down in Wisconsin
Prior Remedies
- Natural attrition of staff
- Reduction of sections - One elementary section reduced in 2024-25 & 2025-26
- Reduction of budgets - General supplies, professional development, service contracts
- Marketing efforts - Video testimonial campaign
Implications of Declining Enrollment
- School funding is tied to enrollment - fewer students means less revenue. We currently receive $11,650 per student in categorical aid.
- Revenue Limits have not been adjusted for inflation since 2014-15, leaving many districts increasingly underfunded.
- Result: More than ¾ of districts currently rely on operating referendums to maintain current levels of programming.
Potential Solutions
We want a solution that:- Maximizes opportunities for students
- Is fiscally responsible
- Can respond effectively to both declining and increasing enrollment - focuses at the elementary level
- Operational referendum
- Closing any schools
- Laying off faculty or staff
One Possible Solution: Elementary Restructuring
How it might look:- Horizon: Grades 4K - 5K - 1st
- Fairview: Grades 2nd - 3rd - 4th
- Parkview: Grades 4K through 4th
Advantages
- Greater consistency in class sizes
- Greater flexibility adjusting to both increasing and decreasing enrollment
- Efficiency of grade-level staff and resources
- Enhanced collaboration of grade-level staff
- Could allow for all-day 4K
Class sizes: 16, 17, 20, 21, 22, 22
Restructured: 19, 19, 19, 20, 20, 21
Considerations
- Movement of students during first year
- Movement of staff during first year
- One additional transition for Horizon & Fairview students between Grades 1 & 2
- Transportation logistics
- Childcare capacity
What's Next?
Initial Staff MeetingsFairview: 8am Sept. 24
Riverview: 2:45pm Sept. 25
Parkview: 8am Sept. 26
Horizon: 8am Sept. 29
PHS: 2:50pm Oct. 1
Community Meeting #1: 5:30pm Oct. 8
Committee of the Whole: 5:30pm Oct. 13
Follow-up Elementary Staff Meetings
Horizon: 8am Oct. 27
Fairview: 8am Oct. 30
Parkview: 8am Oct. 31
Community Meeting #2: 5:30pm Nov. 5
Committee of the Whole: 5:30pm Nov. 10
Regular Board Meeting - Initial Recommendation: 5:30pm Nov. 18
Committee of the Whole - Further Discussion: 5:30pm Dec. 8
Regular Board Meeting - Board Action: 5:30pm Dec. 16