


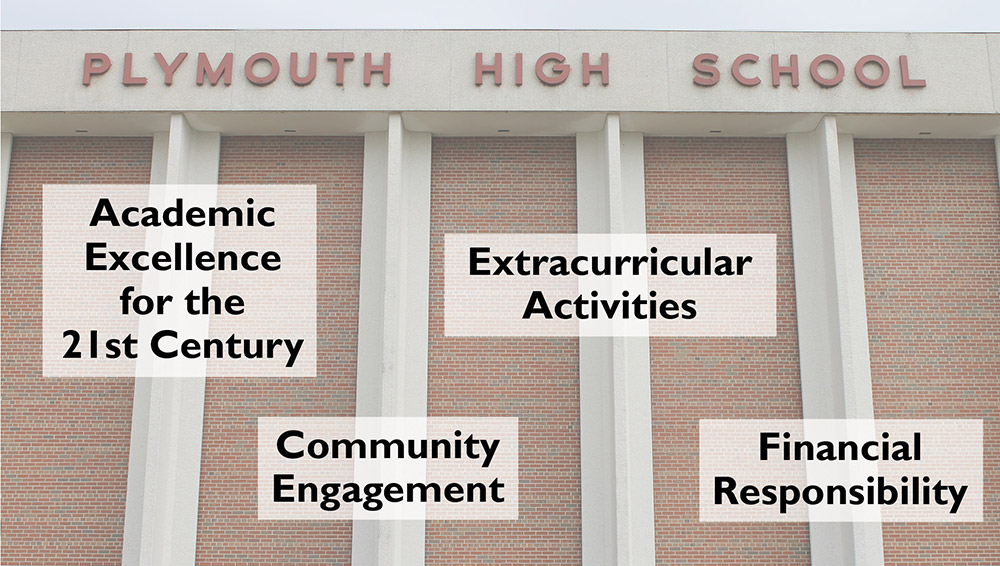
Our Pillars of Excellence
The Board of Education has established these Pillars of Excellence as key principles that distinguish our district and advance our mission.
Academic Excellence
Learning to apply knowledge and skills consistent with the ever-evolving 21st century
Extracurricular Activities
Increasing extracurricular opportunities and participation
Community Engagement
Establishing the Plymouth area as a stellar place in which to live, learn, and prosper
Financial Responsibility
Improving our financial outlook while maximizing and maintaining available capacity
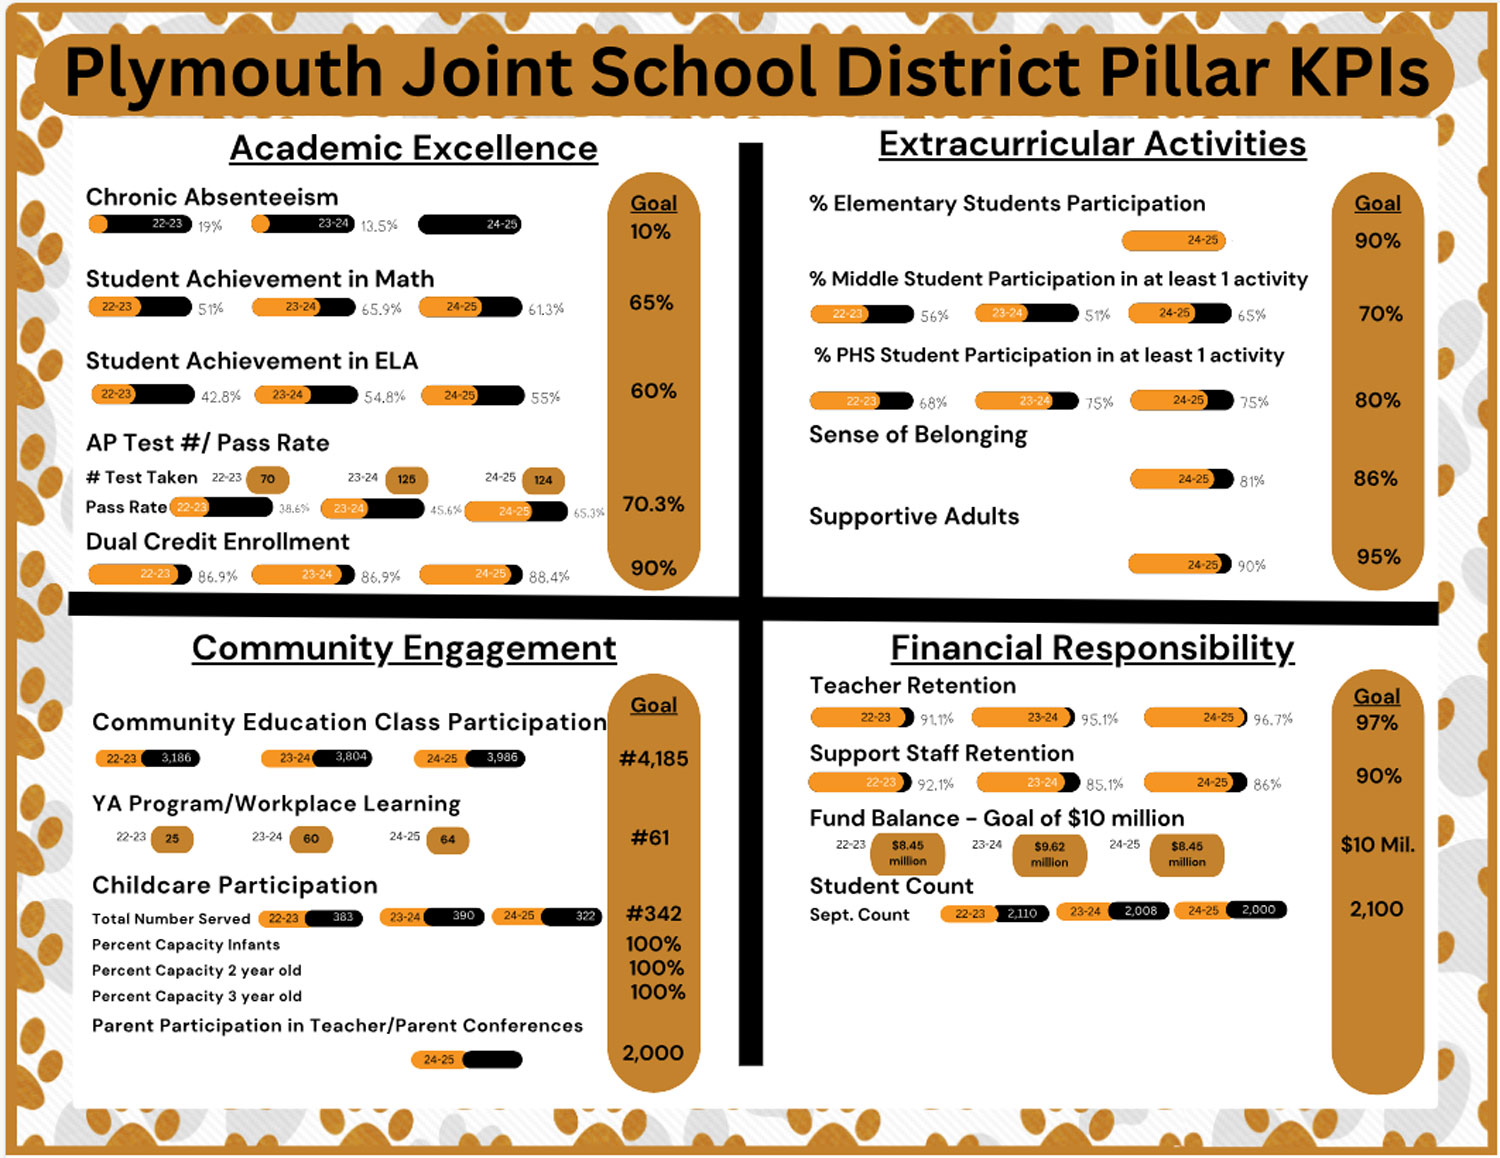
Key Performance Indicators (KPIs)
Our Administration is charged with developing Action Plans to achieve the stated goals for these measures, which were established by our Board of Education.
Percentage of students who miss more than 10% of school days out of the total number of school days during which they were enrolled
2022-23: 19.0%
2023-24: 13.5%
2024-25: NA
Goal: 10.0%
2022-23: 19.0%
2023-24: 13.5%
2024-25: NA
Goal: 10.0%
Percentage of students meeting grade-level expectations (Meeting and Advanced) on the state Forward Exam for grades 3-8
2022-23: 51.0%
2023-24: 65.9%
2024-25: 61.3%
Goal: 65%
2022-23: 51.0%
2023-24: 65.9%
2024-25: 61.3%
Goal: 65%
Percentage of students meeting grade-level expectations (Meeting and Advanced) on the state Forward Exam for grades 3-8
2022-23: 42.8%
2023-24: 54.8%
2024-25: 55.0%
Goal: 60%
2022-23: 42.8%
2023-24: 54.8%
2024-25: 55.0%
Goal: 60%
Number of AP tests administered during the previous year, and percentage of students earning a 3 or better on those tests
2022-23: 70 tests: 38.6%
2023-24: 125 tests: 45.6%
2024-25: 124 tests: 65.3%
Goal: 70.3%
2022-23: 70 tests: 38.6%
2023-24: 125 tests: 45.6%
2024-25: 124 tests: 65.3%
Goal: 70.3%
Percentage of graduating seniors who earned 0.5 credits or more in a Dual Credit course (Transcripted/CAPP/AP)
2022-23: 86.9%
2023-24: 86.9%
2024-25: 88.4%
Goal: 90%
2022-23: 86.9%
2023-24: 86.9%
2024-25: 88.4%
Goal: 90%
Percentage of elementary school students participating in at least one activity
2022-23: na
2023-24: na
2024-25: na
Goal: 90%
2022-23: na
2023-24: na
2024-25: na
Goal: 90%
Percentage of middle-school students involved in at least one extracurricular activity
2022-23: 56%
2023-24: 51%
2024-25: 65%
Goal: 70%
2022-23: 56%
2023-24: 51%
2024-25: 65%
Goal: 70%
Percentage of high-school students involved in at least one extracurricular activity
2022-23: 68%
2023-24: 75%
2024-25: 75%
Goal: 80%
2022-23: 68%
2023-24: 75%
2024-25: 75%
Goal: 80%
Percentage of students who report feeling connected, included, and engaged at school
2022-23: na
2023-24: na
2024-25: 81%
Goal: 86%
2022-23: na
2023-24: na
2024-25: 81%
Goal: 86%
Percentage of students who report at least one teacher or adult at school with whom they are comfortable speaking
2022-23: na
2023-24: na
2024-25: 90%
Goal: 95%
2022-23: na
2023-24: na
2024-25: 90%
Goal: 95%
Number of registrations for Community Education & Recreation-sponsored activities
2022-23: 3,186
2023-24: 3,804
2024-25: 3,986
Goal: 4,185
2022-23: 3,186
2023-24: 3,804
2024-25: 3,986
Goal: 4,185
Number of seniors who participated in Youth Apprenticeship or other workplace learning experiences
2022-23: 25
2023-24: 60
2024-25: 64
Goal: 61
2022-23: 25
2023-24: 60
2024-25: 64
Goal: 61
Number of children who participated in district-provided chilcare during the previous year
2022-23: 383
2023-24: 390
2024-25: 322
Goal: 342
2022-23: 383
2023-24: 390
2024-25: 322
Goal: 342
Number of parents/guardians who attended parent-teacher fall conferences
2022-23: na
2023-24: na
2024-25: na
Goal: 2,000
2022-23: na
2023-24: na
2024-25: na
Goal: 2,000
Retention rate of faculty, excluding retirees but including those who left for all other reasons, such as relocation or personal circumstances
2022-23: 91.1%
2023-24: 95.1%
2024-25: 96.7%
Goal: 97%
2022-23: 91.1%
2023-24: 95.1%
2024-25: 96.7%
Goal: 97%
Retention rate of support staff, excluding retirees but including those who left for all other reasons, such as relocation or personal circumstances
2022-23: 92.1%
2023-24: 85.1%
2024-25: 86.0%
Goal: 90%
2022-23: 92.1%
2023-24: 85.1%
2024-25: 86.0%
Goal: 90%
District Fund Balance, which eliminates the need to do short-term borrowing and is a measure of the financial stability of a school district
2022-23: $8.45 million
2023-24: $9.62 million
2024-25: $8.45 million
Goal: $10 million
2022-23: $8.45 million
2023-24: $9.62 million
2024-25: $8.45 million
Goal: $10 million
Number of students enrolled in the district across all schools and grade levels, as measured by the Third Friday Count
2022-23: 2,110
2023-24: 2,008
2024-25: 2,000
Goal: 2,100
2022-23: 2,110
2023-24: 2,008
2024-25: 2,000
Goal: 2,100